Quantifying Photosynthetic Photon Flux Density: A Technical Guide to PAR Meter Selection and Application
Abstract
The precise quantification of photosynthetically active radiation (PAR) is a critical requirement across a diverse range of scientific and industrial disciplines. Photosynthetic Photon Flux Density (PPFD), measured in micromoles per square meter per second (μmol/m²/s), represents the fundamental metric for assessing the light energy available to drive photosynthetic processes. This guide provides a comprehensive examination of PAR and PPFD measurement principles, with a specific focus on the technological distinctions between integral quantum sensors and scanning spectroradiometers. It further details the application of high-precision instrumentation, such as the LISUN LMS-6000 series spectroradiometers, for ensuring data accuracy in demanding environments from horticultural science to aerospace lighting certification.
The Biophysical Foundation of Photosynthetically Active Radiation
The electromagnetic spectrum segment designated as Photosynthetically Active Radiation encompasses wavelengths from 400 to 700 nanometers. This range corresponds precisely to the spectral absorption profiles of key photosynthetic pigments, primarily chlorophylls a and b, and accessory carotenoids. The quantification of light within this band cannot be accurately achieved with photometric units like lux or lumens, which are weighted by the human eye’s spectral sensitivity (the V(λ) function). Instead, the photon-based system of PPFD is employed. PPFD measures the flux of photosynthetically active photons incident upon a unit surface area per unit time. This direct correlation with the quantum nature of photosynthesis makes PPFD the unequivocally correct unit for evaluating light sources for plant growth, ecological studies, and any application where biological response to light is paramount.
Instrumentation Paradigms: Integral Quantum Sensors versus Scanning Spectroradiometers
The selection of appropriate measurement instrumentation is dictated by the required level of accuracy, spectral resolution, and application flexibility. The market is dominated by two primary technologies: integral quantum sensors and scanning spectroradiometers.
Integral quantum sensors, often referred to as PAR meters, utilize a silicon photodiode coupled with a optical filter designed to approximate the quantum efficiency curve of plant photosynthesis. While cost-effective and portable, these devices are subject to inherent sources of error, including spectral mismatch due to imperfect filter design, cosine response inaccuracies at oblique angles, and calibration drift over time. Their fundamental limitation is the provision of a single, integrated PPFD value without any spectral composition data.
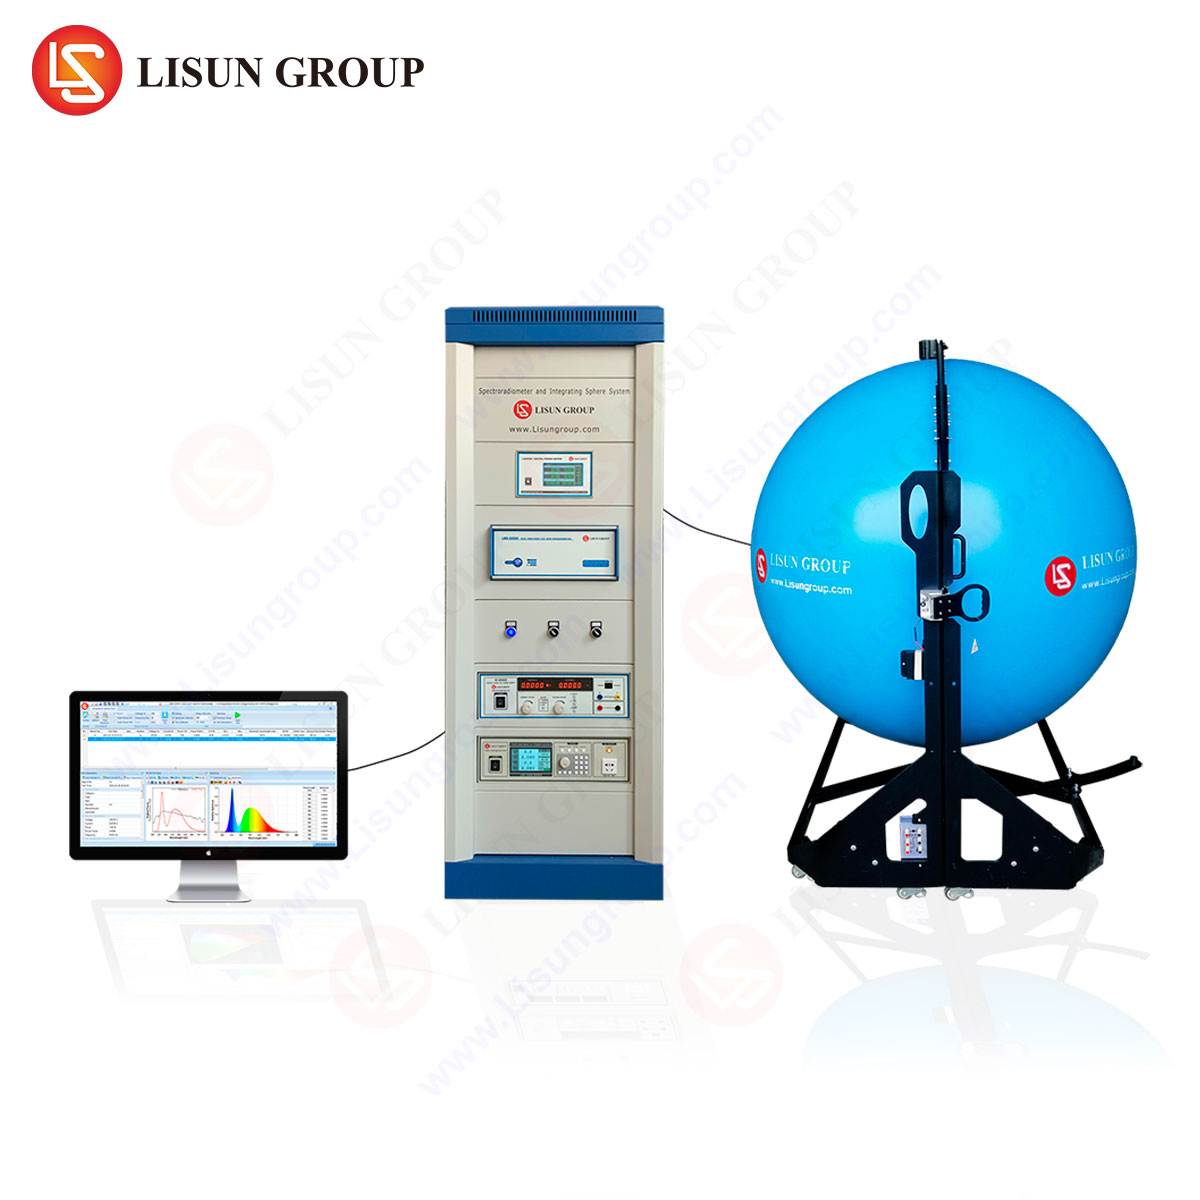
In contrast, scanning spectroradiometers capture the complete spectral power distribution (SPD) of a light source across the PAR spectrum and beyond. By measuring the absolute irradiance at fine wavelength intervals (e.g., 0.1 nm to 1 nm), these instruments enable the calculation of PPFD through numerical integration of the SPD, weighted by the photosynthetic photon flux weighting function. This method provides unparalleled accuracy and, critically, delivers the full spectral context. The LISUN LMS-6000 series of spectroradiometers exemplifies this advanced approach, offering laboratory-grade precision for both research and industrial quality control.
The LISUN LMS-6000 Spectroradiometer: Core Specifications and Operational Principles
The LISUN LMS-6000 represents a state-of-the-art solution for full-spectrum radiometric and photometric analysis. Its design is centered on a high-resolution diffraction grating and a linear CCD array detector, which allows for the simultaneous capture of a wide spectral range with high signal-to-noise ratio. Key specifications that define its performance in PPFD measurement include a spectral range from 350 nm to 800 nm, fully encompassing the PAR region, with a wavelength accuracy of ±0.3 nm and a programmable integration time for optimal signal acquisition across varying light intensities.
The operational principle involves the optical collection of light, its dispersion into constituent wavelengths, and the precise measurement of irradiance at each discrete wavelength interval. Proprietary software then performs the integration calculation for PPFD, as defined by the equation:
[
PPFD = frac{int_{400}^{700} E(lambda) cdot frac{lambda}{NA cdot h cdot c} dlambda}{int{400}^{700} frac{lambda}{N_A cdot h cdot c} dlambda}
]
Where ( E(lambda) ) is the spectral irradiance, ( lambda ) is the wavelength, ( N_A ) is Avogadro’s number, ( h ) is Planck’s constant, and ( c ) is the speed of light. This direct calculation from first principles eliminates the spectral mismatch errors inherent in filter-based meters. The instrument’s calibration, traceable to national standards institutes (NIST, PTB, etc.), ensures long-term measurement integrity.
Advanced Applications in Horticultural Science and Controlled Environment Agriculture
In controlled environment agriculture (CEA) and horticultural research, the spectral quality of light is as critical as its intensity. The simplistic use of integrated PPFD can be misleading when comparing different lighting technologies, such as broad-spectrum white LEDs versus narrow-band red-blue arrays. While two light sources may yield an identical PPFD value, their effects on plant morphology, photomorphogenesis, and secondary metabolite production can differ dramatically.
The LISUN LMS-6000 spectroradiometer enables researchers and commercial growers to move beyond PPFD and perform detailed spectral analysis. It allows for the calculation of specific photon ratios, such as the Red to Far-Red ratio (R:FR, 660:730 nm) critical for shade avoidance responses, or the Blue to Green ratio which can influence stomatal opening and plant architecture. Furthermore, it can verify the stability and consistency of LED spectra over time, a vital factor in long-term growth trials and quality assurance for LED manufacturers supplying the horticultural market.
Validation and Compliance in Automotive and Aerospace Lighting Systems
The automotive and aerospace industries mandate rigorous testing of all lighting components for safety, performance, and regulatory compliance. This extends to interior and exterior lights that must meet specific photometric and colorimetric standards. For instance, the illumination provided by cockpit instrument panels or cabin reading lights must be sufficient for human vision without causing pilot or driver fatigue, but it must also be assessed for its potential impact on plant and animal life in sensitive transport scenarios, such as the carriage of live cargo.
The LMS-6000 is employed to measure the PPFD and full spectrum of aircraft navigation lights, runway approach lighting, and automotive headlamps and daytime running lights (DRLs). Its high-speed measurement capability allows for the characterization of pulsed LED systems, while its precision ensures compliance with international standards such as FAA TSO-C96 and SAE J578. The ability to generate detailed test reports with spectral graphs and calculated metrics is indispensable for certification processes.
Precision Measurement in Photovoltaic and Display Device Characterization
Beyond biological applications, the accurate measurement of irradiance is fundamental to the photovoltaic (PV) industry and display technology. While PV cell testing typically focuses on the broader solar spectrum, research into next-generation agrivoltaics—the co-location of agriculture and solar power generation—requires an understanding of the light spectrum transmitted through or reflected by semi-transparent PV panels onto the crops below. The LMS-6000 provides the data necessary to optimize these systems for dual energy and food production.
In the display industry, the light emitted by OLED and LCD screens used in specialized environments, such as plant growth chambers or medical diagnostic equipment, must be precisely controlled. A spectroradiometer can characterize the emissive properties of these displays, ensuring that the light output intended for a biological stimulus (e.g., in a growth chamber control system) matches its programmed spectral recipe, thereby guaranteeing experimental repeatability.
Competitive Advantages of High-Resolution Spectroradiometry
The primary advantage of utilizing an instrument like the LISUN LMS-6000 over simpler devices is the elimination of uncertainty. Its direct spectral measurement provides a foundation of data from which dozens of relevant metrics can be derived, including PPFD, Yield Photon Flux Density (YPFD) for photosynthesis beyond 700 nm, color rendering index (CRI), correlated color temperature (CCT), and chromaticity coordinates. This multi-parameter capability makes it a universal tool for lighting labs, R&D departments, and quality control centers.
Key competitive differentiators include:
- High Fidelity Data: Superior wavelength accuracy and optical resolution enable the detection of subtle spectral features that are averaged out by filter-based meters.
- Application Versatility: A single instrument serves the needs of the lighting, display, automotive, aerospace, and life sciences sectors.
- Regulatory-Grade Accuracy: Calibration traceability and robust construction ensure that measurements are defensible in compliance and certification contexts.
- Future-Proofing: As research uncovers new biological responses to narrow-band light (e.g., UV and Far-Red effects), having full spectral data allows for retrospective analysis without the need for re-testing.
Implementation and Best Practices for Accurate PPFD Data Acquisition
To obtain reliable and reproducible PPFD data, a rigorous measurement protocol must be followed. The sensor’s cosine corrector must be positioned precisely at the plane of interest, whether it is the canopy level in a greenhouse or a test point in an integrating sphere. The ambient temperature should be stable, as temperature fluctuations can affect the performance of both the light source and the detector. For spatially heterogeneous environments, such as a grow room, a grid of multiple measurements should be taken to calculate the average PPFD and the spatial distribution uniformity. The use of a spectroradiometer like the LMS-6000 further necessitates regular calibration verification against a standard lamp to maintain long-term measurement integrity, a process that is streamlined by the instrument’s software suite.
Frequently Asked Questions
Q1: What is the practical consequence of spectral mismatch error in a filter-based PAR meter when measuring different LED types?
A filter-based meter calibrated against a specific light source (e.g., a tungsten halogen lamp) can exhibit significant errors when measuring light sources with discontinuous spectra, such as narrow-band red and blue LEDs. It may over-report the PPFD of red LEDs by 10% or more, while under-reporting the PPFD of white LEDs with a strong blue pump. This leads to incorrect assessments of a lighting system’s true photosynthetic efficacy and can invalidate comparative studies between lighting technologies.
Q2: Why is wavelength accuracy critical when calculating specific photon ratios like R:FR?
The Red to Far-Red ratio is highly sensitive to the exact wavelengths used in the calculation. A slight wavelength shift of even 1 nm can significantly alter the calculated ratio, as one is measuring on the steep slopes of the chlorophyll and phytochrome absorption curves. The ±0.3 nm accuracy of the LMS-6000 ensures that these biologically critical ratios are calculated with high confidence, enabling precise research into plant photomorphogenesis.
Q3: Can the LISUN LMS-6000 be used for long-term, continuous monitoring of PPFD in a greenhouse or growth chamber?
While the LMS-6000 is engineered for high-precision spot-checking and laboratory characterization, it is not typically deployed as a dedicated, permanent environmental sensor. For long-term monitoring, it is often used to calibrate and validate networks of lower-cost, fixed-installation PAR sensors, ensuring the entire monitoring system is traceable to a primary standard. This hybrid approach provides both continuous data and periodic high-accuracy verification.
Q4: How does the instrument handle the measurement of pulsed light sources, which are common in LED dimming strategies?
The LMS-6000 features a programmable integration time that can be synchronized with the pulse frequency of the light source. By setting an integration time that encompasses an integer number of full pulse cycles, the instrument accurately captures the average irradiance of the pulsed waveform. This capability is essential for characterizing the performance of pulse-width modulated (PWM) LED systems used in research and industry.


