A Comprehensive Guide to LISUN LED Lumens Testing Machines: Principles, Applications, and the LPCE-3 System
Introduction to Photometric and Radiometric Measurement
The accurate quantification of light output is a cornerstone of modern optical engineering and lighting science. Parameters such as luminous flux (lumens), chromaticity, and efficacy are not merely marketing figures but critical data points that dictate product performance, regulatory compliance, and end-user satisfaction. The measurement of these parameters requires sophisticated instrumentation capable of capturing the full spectral power distribution of a light source and converting it into standardized photometric and colorimetric quantities. LISUN’s LED Lumens Testing Machines, particularly those based on integrating sphere systems, represent a class of instruments designed for this precise purpose. These systems provide a controlled environment for comprehensive light measurement, serving industries where optical precision is non-negotiable.
Fundamental Principles of Integrating Sphere Photometry
An integrating sphere operates on the principle of multiple diffuse reflections to create a spatially uniform light field. When a light source is placed inside the sphere, its light is scattered and reflected numerous times by the highly reflective, diffuse coating on the sphere’s interior surface. This process homogenizes the spatial and angular characteristics of the light, ensuring that the radiance measured at a single point on the sphere’s wall, via a baffle-shielded port, is directly proportional to the total luminous flux emitted by the source. The key component is the spectroradiometer, which is attached to the sphere. It does not measure illuminance directly but instead captures the absolute spectral power distribution (SPD) of the integrated light. This SPD is then computationally weighted against the CIE standard photopic luminosity function V(λ) to derive luminous flux in lumens, alongside a suite of other photometric and colorimetric data including chromaticity coordinates (CIE 1931 x,y and u’v’), correlated color temperature (CCT), color rendering index (CRI), and spectral power distribution.
Architectural Overview of the LISUN LPCE-3 Integrated Sphere System
The LISUN LPCE-3 system exemplifies a high-precision solution for LED lumens testing. It is an integrated apparatus comprising a spectroradiometer, an integrating sphere, a photometer sensor, and specialized software. The system is engineered to comply with stringent international standards such as CIE 177, CIE 13.3, CIE 15, IESNA LM-79, and EN13032-1. Its architecture is designed to mitigate common measurement errors and provide traceable, reliable data. The core components include a high-resolution CCD spectroradiometer that captures detailed spectral data from 380nm to 780nm, ensuring accurate colorimetric calculations. The sphere itself is constructed with a molded shell and coated with a stable, highly reflective BaSO4 (Barium Sulfate) diffuse material, which offers superior reflectance characteristics and longevity compared to other coatings. A key feature is the inclusion of an auxiliary lamp, used for the sphere’s self-calibration procedure to determine its precise multiplicative factor, thereby correcting for sphere wall imperfections and port losses.
Technical Specifications and Performance Metrics of the LPCE-3
The performance of the LPCE-3 is defined by its detailed technical specifications, which dictate its application scope and accuracy. The system is available with spheres of varying diameters (e.g., 0.5m, 1m, 1.5m, 2m) to accommodate different source sizes and total flux outputs. A 1-meter sphere is a common configuration for general LED testing. The spectroradiometer typically boasts a wavelength accuracy of ±0.3nm and a high signal-to-noise ratio, which is critical for detecting subtle spectral features. For luminous flux, the measurement uncertainty can be as low as ±3% for standard LEDs when calibrated with a reference source traceable to NIST or other national metrology institutes. The system’s software calculates a comprehensive set of parameters, as detailed in the table below.
Table 1: Key Measurement Parameters of the LPCE-3 System
| Parameter Category | Specific Metrics |
| :— | :— |
| Photometric | Luminous Flux (Lumens), Luminous Intensity, Luminous Efficacy (lm/W) |
| Colorimetric | Chromaticity Coordinates (x, y, u’, v’), Correlated Color Temperature (CCT), Peak Wavelength, Dominant Wavelength |
| Color Rendering | CRI (Ra), Extended CRI (R1-R15), CRI R9 (Saturated Red) |
| Electrical | Voltage, Current, Power, Power Factor |
| Spectral | Spectral Power Distribution (SPD), Spectral Purity, Half Bandwidth |
Calibration Protocols and Measurement Traceability
The accuracy of any integrating sphere system is contingent upon a rigorous calibration protocol. For the LPCE-3, this process is twofold. First, the spectroradiometer undergoes a wavelength and intensity calibration using standard lamps, such as tungsten halogen lamps with known spectral distributions, to establish its absolute responsivity. Second, and more critically for total luminous flux, the entire sphere system must be calibrated using a standard lamp of known total luminous flux. This process determines the sphere’s “luminous flux constant,” or K-factor. The auxiliary lamp integrated into the LPCE-3 sphere is used for routine verification of this K-factor, ensuring long-term measurement stability and traceability to national standards. This practice is essential for maintaining compliance with quality management systems like ISO/IEC 17025 in testing laboratories.
Application in LED and OLED Manufacturing Quality Control
In the high-volume production of LEDs and OLEDs, the LPCE-3 system is deployed for binning and quality assurance. Manufacturers must sort LEDs into tight bins based on luminous flux and chromaticity to ensure consistency in final products. The system’s high throughput and automation capabilities allow for rapid testing of individual components. For OLED panels, which are area light sources, the integrating sphere effectively captures the total light output, providing critical data on efficacy and color uniformity that is vital for display and lighting applications. The accurate measurement of CRI, and particularly the R9 value, is crucial for high-quality lighting products where true color rendition is required.
Automotive Lighting Compliance and Performance Validation
Automotive lighting, encompassing headlamps, daytime running lights (DRLs), signal lights, and interior lighting, is subject to rigorous international regulations (e.g., ECE, SAE, FMVSS). The LPCE-3 system is used to validate the total luminous flux of these lighting assemblies. For instance, regulations specify minimum and maximum flux levels for brake lights and turn signals to ensure they are perceptible without causing glare. The system’s ability to measure the spectral characteristics of emerging technologies like OLED taillights and laser-based headlamps is also critical for R&D and type-approval testing.
Aerospace and Aviation Lighting Certification
The aviation industry demands absolute reliability from its components, including lighting. Cockpit instrument panels, cabin lighting, and external navigation lights must meet strict performance and safety standards set by bodies like the FAA and EASA. The light output must be within specified limits to ensure readability under all conditions without compromising night vision. The LPCE-3 provides the precise photometric data required for the certification of these lighting systems, where failure is not an option.
Specialized Applications in Photovoltaic and Scientific Research
Beyond traditional lighting, the LPCE-3’s spectroradiometric capabilities are leveraged in the photovoltaic industry for characterizing the spectral response of solar cells and modules. By using a calibrated light source with a known SPD, researchers can correlate the output of a PV device with the specific wavelengths of light it receives. In scientific laboratories, the system is used to study novel luminescent materials, such as phosphors for next-generation displays or quantum dots, where understanding the absolute spectral output and efficiency is fundamental to the research.
Urban Lighting Design and Photobiological Safety
Urban planners and lighting designers utilize data from systems like the LPCE-3 to make informed decisions about public lighting. By accurately measuring the spectral output of different streetlamp technologies (e.g., High-Pressure Sodium vs. LED), they can model and predict factors like mesopic vision performance, sky glow, and environmental impact on wildlife. Furthermore, the system can be used to assess the photobiological safety of light sources as per IEC 62471, classifying them into risk groups based on potential blue light hazard and other optical radiation dangers.
Comparative Analysis with Goniophotometric Methods
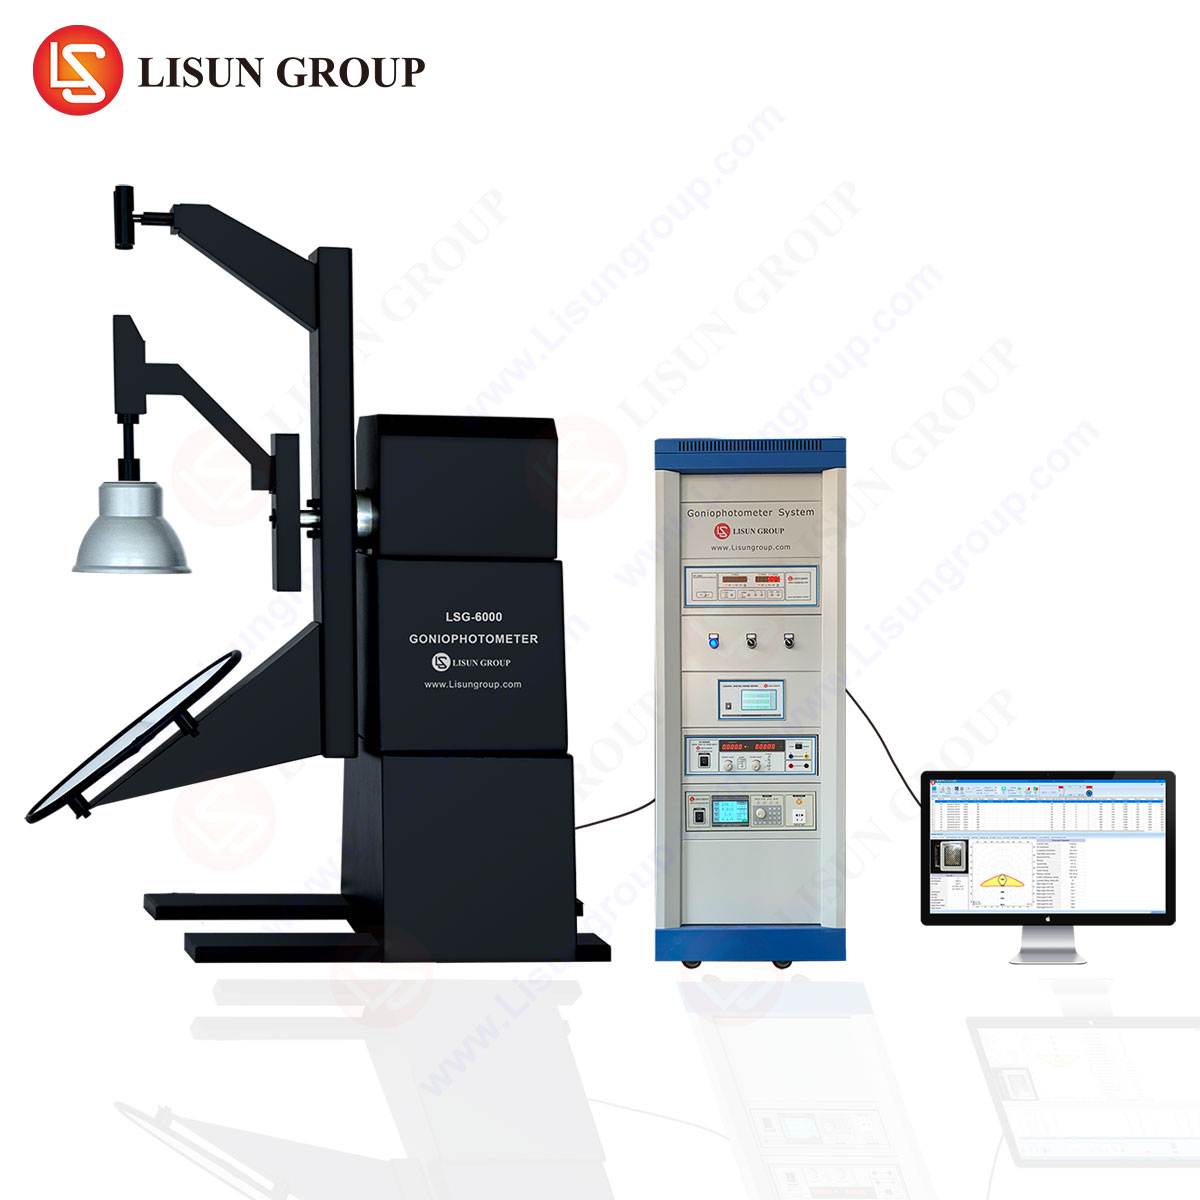
While integrating spheres are ideal for measuring the total flux of light sources, a goniophotometer is the preferred instrument for measuring the spatial distribution of light (intensity distribution) from luminaires. The LPCE-3 and a goniophotometer are complementary technologies. The sphere provides a rapid, integrated total flux value, which is a key input for the goniophotometer’s calculation of luminous flux. For R&D, the sphere is often used for component-level testing, while the goniophotometer is used for the final assembled luminaire. The LPCE-3 system’s efficiency makes it superior for high-volume component testing where spatial data is not required.
Frequently Asked Questions
Q1: What is the difference between using a spectroradiometer and a photometer sensor inside the integrating sphere?
A spectroradiometer measures the absolute spectral power distribution, from which all photometric and colorimetric values (lumens, CCT, CRI) are calculated. A photometer sensor, which is filtered to match the V(λ) curve, measures illuminance directly. In a high-precision system like the LPCE-3, the spectroradiometer is the primary sensor. The photometer can serve as a fast-check reference, but the spectral data provides a far more comprehensive and fundamentally accurate dataset.
Q2: How does the size of the integrating sphere affect measurement accuracy?
Sphere size is critical. A larger sphere minimizes the effect of self-absorption, where the test source blocks and absorbs its own reflected light, a significant error for large or high-power sources. As a rule of thumb, the source should not occupy more than 2-5% of the sphere’s total volume. For a single LED package, a 0.5m sphere may suffice, while a complete LED lamp or a long linear fluorescent tube requires a 1.5m or 2m sphere for accurate results.
Q3: Can the LPCE-3 system measure the flicker percentage of an LED light source?
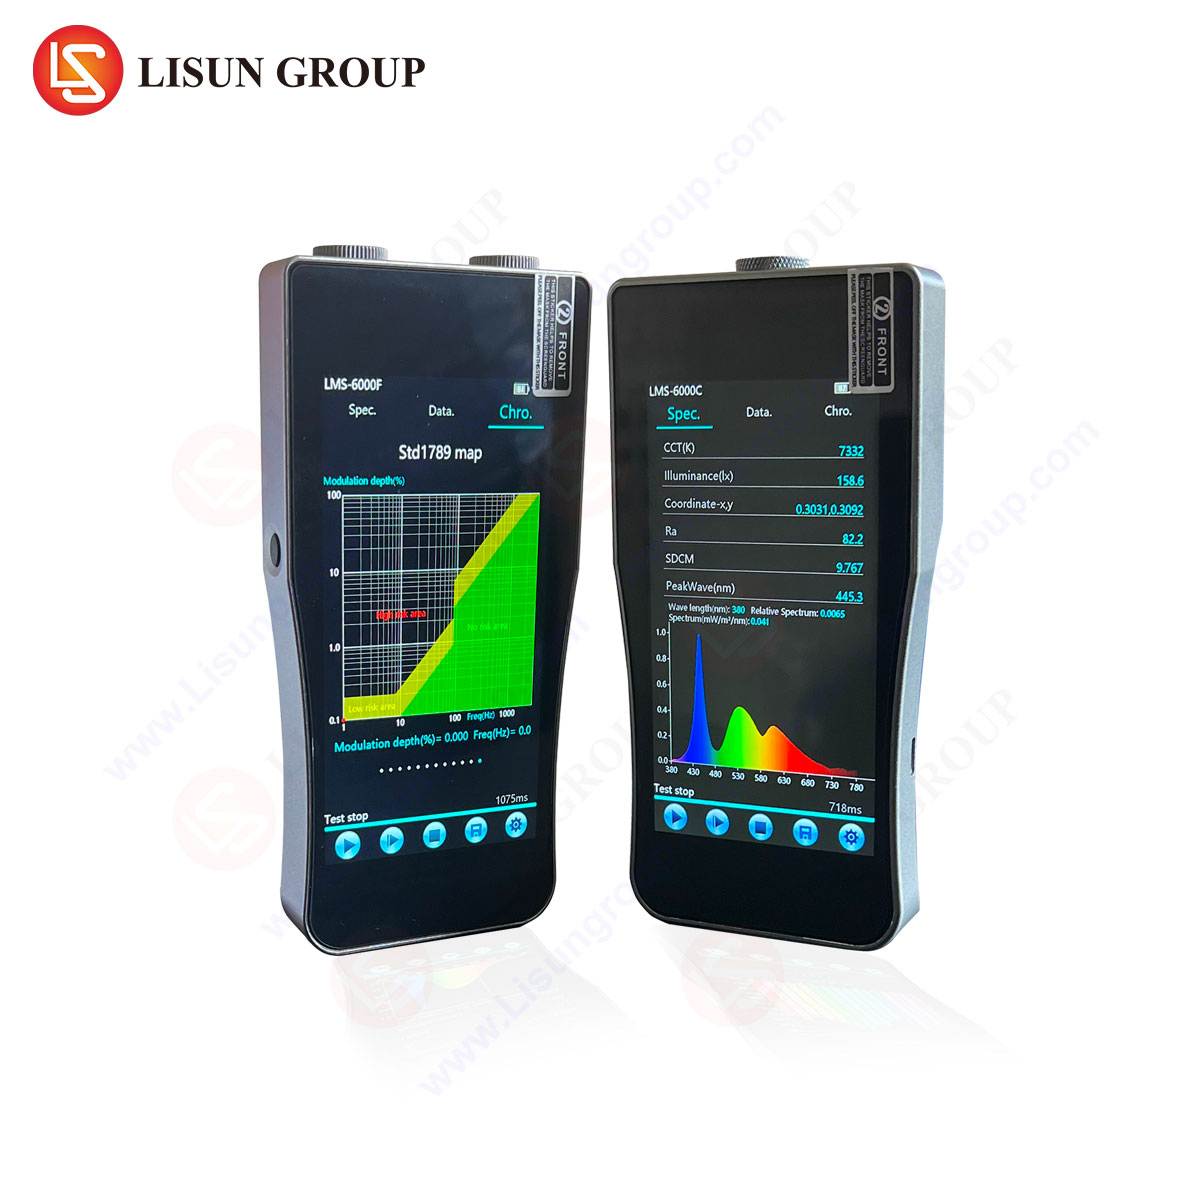
Yes, provided the spectroradiometer is equipped with a high-speed trigger or synchronous control function. By synchronizing the spectral capture with the AC power cycle or the driven waveform of the LED, the system can capture the maximum, minimum, and average spectral radiance. From this data, parameters like percent flicker and flicker index can be calculated according to standards like IEEE 1789.
Q4: Why is the CRI R9 value particularly important for LED testing, and can the LPCE-3 report it?
The CRI R9 value measures how accurately a light source renders a deep red color. Many early and low-quality white LEDs, which use a blue pump and yellow phosphor, have a significant deficiency in the red part of the spectrum, leading to a very low or negative R9 value. This results in poor rendition of skin tones, meats, and red objects. The LPCE-3 system calculates the full set of CRI values (R1-R15), and a high R9 value is now a key indicator of a quality, full-spectrum LED light source.
Q5: How is the system calibrated for measuring high-power LED arrays that generate significant heat?
The calibration process uses a standard lamp that is typically operated at a specific color temperature and power level. For high-power devices, thermal management is crucial. The measurement procedure must account for the thermal stabilization of the Device Under Test (DUT). The DUT is powered on and allowed to reach its steady-state operating temperature before measurement begins, as the luminous flux and chromaticity of LEDs are highly temperature-dependent. The sphere’s design often includes ventilation ports to manage heat buildup during extended testing.


