A Methodological Framework for Goniophotometer Selection in Advanced Photometric Laboratories
The accurate characterization of a luminaire’s spatial light distribution is a cornerstone of lighting science, impacting fields ranging from energy efficiency compliance to human-centric lighting design. The goniophotometer stands as the primary instrument for this critical task, enabling the precise measurement of luminous intensity distribution, total luminous flux, and derived photometric quantities. The selection of an appropriate goniophotometer system is therefore a strategic decision that directly influences the scope, accuracy, and commercial validity of a laboratory’s testing capabilities. This article provides a systematic framework for this selection process, focusing on technical specifications, operational principles, and alignment with international standards, with a specific examination of the LISUN LSG-6000 as a paradigm for Type C goniophotometry.
Fundamental Principles of Goniophotometric Measurement
Goniophotometry operates on the principle of measuring the luminous intensity of a light source from a comprehensive set of spherical coordinates. The luminaire is rotated around its photometric center in two perpendicular axes, typically the horizontal (C-axis: γ-angles) and vertical (B-axis: C-planes), while a fixed photometer measures the intensity at each point. This process generates a three-dimensional intensity distribution, which is computationally integrated to yield total luminous flux. Two primary geometric configurations dominate modern systems: Type A, where the luminaire rotates around a vertical axis, and Type C, where it rotates around a vertical axis that is perpendicular to the photometric axis. The Type C configuration, as implemented in the LISUN LSG-6000, is generally preferred for most luminaires as it more naturally represents the orientation in which they are typically installed, such as streetlights and downlights, and simplifies the measurement of planar light sources.
The integrity of the data is contingent upon a controlled optical environment. Measurements must be conducted within a darkroom to eliminate stray light, and the distance between the luminaire and the detector must satisfy the far-field condition (inverse-square law) or be corrected for near-field effects using specialized software. The choice between a moving detector (Type L) and a moving light source (Type T) system further defines the mechanical architecture, with Type T systems like the LSG-6000 offering advantages for testing heavy or thermally sensitive luminaires.
Analyzing Core Technical Specifications and System Architecture
A granular analysis of a goniophotometer’s specifications is paramount. Key parameters include the measurement range, angular resolution, accuracy, and maximum payload capacity. The measurement range, defined by the goniometer’s angular travel (e.g., 0° to 360° in γ and 0° to 180° or more in C-planes), determines the types of luminaires that can be fully characterized. Bidirectional or asymmetric light sources, common in display backlighting and architectural lighting, require full spherical coverage.
Angular resolution, the smallest step increment of the rotation stages, dictates the granularity of the intensity distribution curve. High resolution is critical for capturing sharp beam cut-offs in automotive lighting or detailed near-field data for display and sensor calibration. System accuracy is a composite metric influenced by the photometer’s calibration (traceable to national standards like NIST or PTB), the mechanical precision of the goniometer, and the alignment of the luminaire’s photometric center. Payload capacity is a practical consideration; while testing small LED modules may require only a few kilograms, evaluating large stadium lights or photovoltaic modules necessitates robust systems capable of supporting 50 kg or more.
The system architecture extends beyond the goniometer itself to include the spectroradiometer or photometer, power supply, and environmental control. For LED and OLED manufacturing, where chromaticity consistency is critical, integrating a high-precision array spectroradiometer is essential for measuring correlated color temperature (CCT), Color Rendering Index (CRI), and color coordinates within the spatial distribution. Thermal management is another vital aspect, as LED performance is intrinsically linked to junction temperature. Some advanced systems incorporate temperature monitoring and environmental chambers to perform measurements under controlled thermal conditions, providing data relevant to real-world performance and lifetime predictions.
The LSG-6000: A Type C Goniophotometer for Comprehensive Compliance Testing
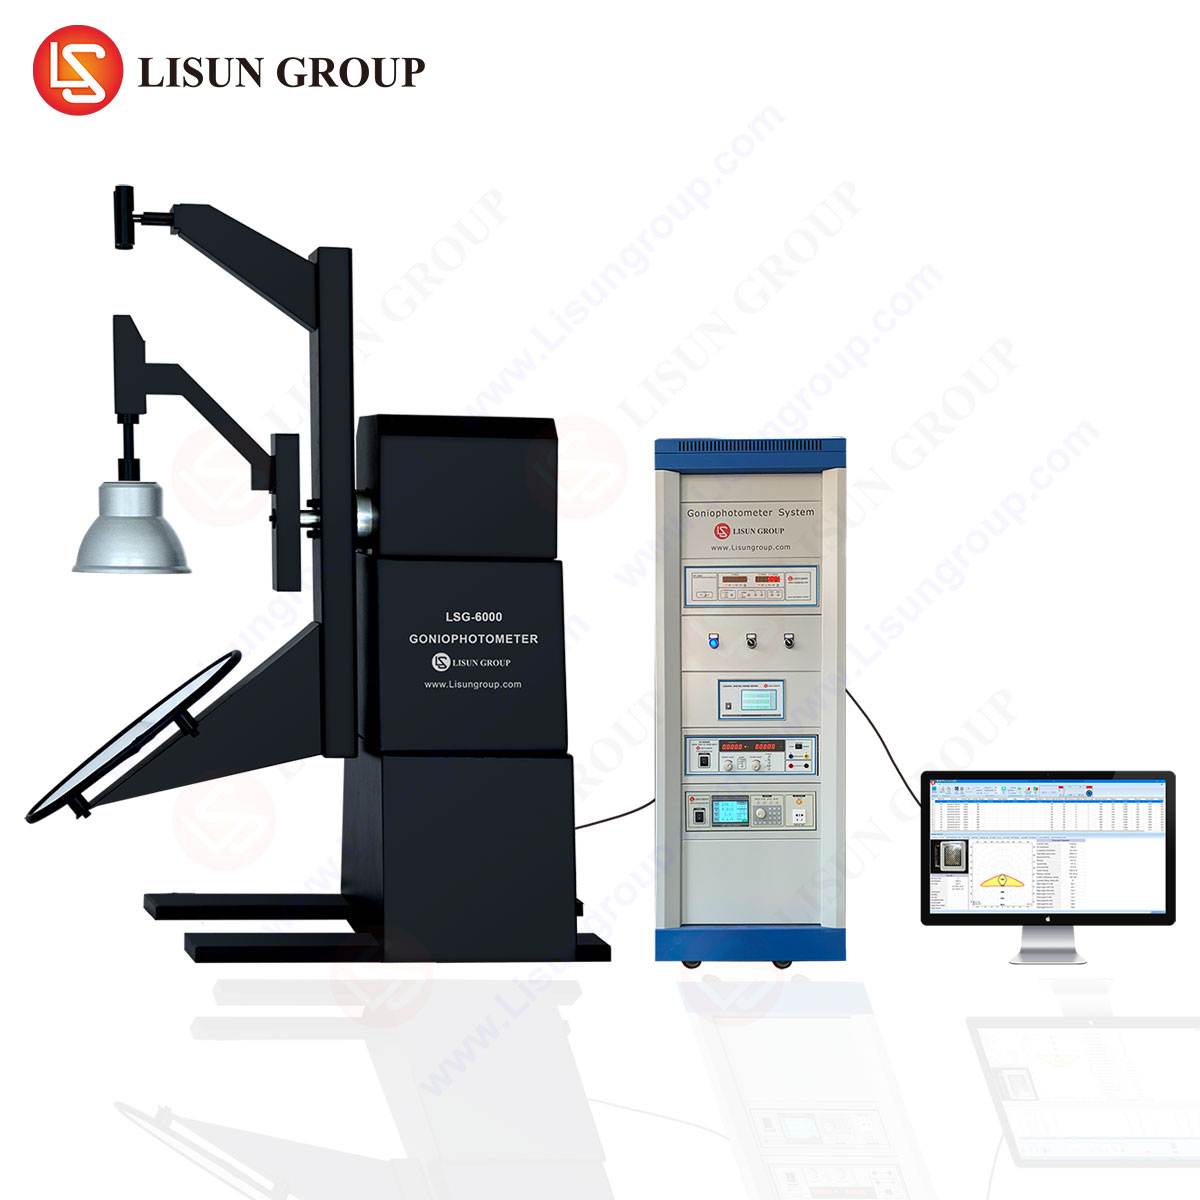
The LISUN LSG-6000 exemplifies a fully automated, large mirror Type C goniophotometer designed for high-accuracy photometric and colorimetric testing of various luminaires. Its design prioritizes stability, precision, and adherence to international standards, making it a suitable instrument for third-party certification labs and high-volume manufacturing quality control.
Specifications and Testing Principles:
The LSG-6000 features a large, single mirror system where the luminaire rotates along the vertical (C-axis) and horizontal (γ-axis) while the detector remains stationary. This configuration minimizes the movement of electrical and data cables connected to the luminaire, reducing torque and potential measurement artifacts. Its typical measurement distance of 5m, 10m, or greater ensures compliance with the far-field condition for a wide range of products. The system boasts a high angular resolution (e.g., 0.1° or finer) and an accuracy for luminous flux measurement that can reach ±1.5% or better, contingent on master standard calibration. It supports a substantial payload, often exceeding 50 kg, accommodating large and heavy luminaires.
The testing principle is governed by software that automates the scanning sequence, data acquisition, and post-processing. The software calculates all required photometric data, including luminous intensity distribution curves, total luminous flux, luminaire efficacy, beam angles, and utilization factors. When coupled with a spectroradiometer, it provides a full spatial color distribution map.
Industry Use Cases and Standards Compliance:
The application of a system like the LSG-6000 spans numerous industries, guided by a framework of international standards.
- Lighting Industry & LED Manufacturing: It is extensively used for testing indoor and outdoor LED luminaires against standards such as IEC 60598-1 (general safety), IES LM-79 (electrical and photometric measurements of solid-state lighting products), and ENERGY STAR program requirements. For street lighting, compliance with IESNA TM-15 (luminaire classification) and EN 13201 is critical for municipal lighting design and tenders.
- Display Equipment Testing: The spatial uniformity of backlight units (BLUs) for LCDs and the angular color shift of OLED displays are key quality metrics. The LSG-6000 can characterize these parameters, supporting R&D and production line validation.
- Urban Lighting Design and Medical Lighting: In urban contexts, verifying the light pollution metrics, such as Upward Light Output Ratio (ULOR), as defined by IDA and IES TM-15, is possible. For medical lighting, ensuring uniform, shadow-free illumination in surgical lights per standards like IEC 60601-2-41 requires detailed goniophotometric analysis.
- Stage and Studio Lighting: The system can profile complex beam shapes, field angles, and gobo projections, providing manufacturers with the data needed to create reliable photometric data sheets for lighting designers.
- Photovoltaic Industry and Optical R&D: While primarily for light emission, the principles of goniophotometry can be adapted for measuring the angular acceptance of light for photovoltaic cells or the bidirectional reflectance distribution function (BRDF) of materials, which is crucial for optical component production and sensor development.
Competitive Advantages:
The LSG-6000’s competitive position is anchored in its robust mechanical construction, which minimizes vibration and ensures long-term rotational accuracy. The integration of a large mirror reduces the required darkroom length compared to direct-detector systems. Its software ecosystem, capable of controlling ancillary equipment like power supplies and environmental sensors, creates a unified and automated testing workflow. This automation significantly reduces human error and increases throughput, a critical factor in high-volume manufacturing environments. Furthermore, its design inherently supports the stringent requirements of IES LM-79, which mandates specific measurement geometries and data reporting formats for SSL products, making it a preferred tool for laboratories seeking NVLAP accreditation or other international lab recognitions.
Integrating Ancillary Systems for Enhanced Data Fidelity
A goniophotometer’s core is only one part of a complete measurement solution. The selection of ancillary systems is equally critical for data fidelity. A stable, programmable AC/DC power supply is necessary to provide the luminaire with its rated voltage and frequency, eliminating line voltage fluctuations as a source of error. For SSL products, a DC power supply with high precision is often required.
The photodetector or spectroradiometer is the “eye” of the system. A V(λ)-corrected photometer is sufficient for photometric measurements, but the growing emphasis on light quality demands a fast-scanning array spectroradiometer. This allows for the simultaneous capture of spectral power distribution (SPD) across the visible spectrum at every measurement angle, enabling the calculation of CCT, CRI (R1-R15), Rf/Rg (IES TM-30), and other color fidelity metrics throughout the spatial distribution.
Thermal monitoring systems, using thermocouples or IR cameras, can correlate photometric output with luminaire temperature. For scientific research laboratories investigating thermal derating or lifetime performance, the ability to log temperature data synchronously with photometric data is invaluable. Finally, the software platform must not only control the hardware but also offer advanced data analysis, visualization tools, and direct reporting in standard formats (e.g., IES, EULUMDAT, CIE).
A Strategic Selection Matrix for Laboratory Applications
The final selection should be guided by a weighted matrix that aligns system capabilities with laboratory objectives. The following table provides a comparative framework for common laboratory profiles.
| Laboratory Profile | Primary Requirement | Recommended Goniometer Type | Key Specifications | Critical Ancillary Systems |
|---|---|---|---|---|
| LED/OLED Manufacturing QC | High throughput, color consistency | Type C (e.g., LSG-6000) | High angular speed, integrated spectroradiometer, automated reporting | Stable DC power supply, temperature logger |
| Scientific Research | Maximum accuracy, flexibility | Type C or Type A (research-grade) | Highest angular resolution, low uncertainty, modular for custom setups | Research-grade spectroradiometer, environmental chamber |
| Urban & Architectural Lighting | Compliance with zoning laws | Type C | Full spherical measurement, software calculating ULOR/TM-15 metrics | Programmable AC power supply |
| Display & Sensor Testing | Near-field data, small form factor | Specialized Type C or robotic arm | Very high resolution, adapted for small samples | High-sensitivity detector, custom fixturing |
| Stage & Studio Lighting | Complex beam shape analysis | Type C | High dynamic range detector, long throw distance | Dimming control interface |
Frequently Asked Questions
Q1: What is the significance of the “Type C” classification in goniophotometers like the LSG-6000?
Type C refers to a coordinate system where the luminaire’s first rotation is around an axis perpendicular to its photometric axis. This orientation is more intuitive for most lighting applications (e.g., a streetlight shining downward) and is the preferred geometry for many international standards, including those from the IES and CIE, as it simplifies data interpretation and application in lighting design software.
Q2: Can a goniophotometer measure the true efficacy (lm/W) of an LED luminaire?
Yes, this is a primary function. The goniophotometer measures the total luminous flux (lumens) by integrating the spatial intensity distribution. When this value is divided by the electrical input power (Watts) measured by a precision power analyzer integrated into the system, the result is the luminaire efficacy. This is a critical metric for energy efficiency programs like ENERGY STAR and DLC.
Q3: Why is a spectroradiometer an important accessory for modern goniophotometry?
A spectroradiometer moves beyond photometry (perceived brightness) into the realm of colorimetry. It allows the laboratory to measure how the color properties of a luminaire—such as its Correlated Color Temperature (CCT) and Color Rendering Index (CRI)—change when viewed from different angles. This “angular color uniformity” is a major quality differentiator, especially for high-CRI LED products used in retail, museum, and medical lighting.
Q4: How does the measurement distance impact the results and the required laboratory space?
The measurement distance must be sufficient to ensure the photometer is in the far-field (photometric) region of the luminaire, where the inverse-square law holds true. If the distance is too short, near-field effects will cause significant measurement errors. Standards like LM-79 specify minimum distances based on the luminaire’s size and beam pattern. A system like the LSG-6000, with a 5m or 10m standard distance, is designed to meet these requirements for a vast majority of commercial luminaires, but this directly dictates the necessary length of the darkroom facility.


