Advanced Metrological Approaches for LED System Characterization and Validation
The proliferation of Light Emitting Diode (LED) technology across a diverse spectrum of industries has necessitated a concomitant evolution in photometric and radiometric measurement methodologies. The inherent characteristics of LEDs—including their directional emission, spectral discreteness, and sensitivity to thermal and electrical operating conditions—render traditional measurement techniques, developed for incandescent and fluorescent sources, inadequate for precise characterization. Achieving optimal performance, compliance with international standards, and ensuring product longevity requires advanced, integrated measurement solutions capable of delivering high-fidelity data across a multitude of parameters. This treatise delineates the critical components and applications of sophisticated LED measurement systems, with a specific focus on integrating sphere-based spectroradiometry as a cornerstone technology.
Fundamental Principles of Integrating Sphere Spectroradiometry
The accurate measurement of total luminous flux, radiant power, and spectral distribution from a light source is predicated on the principle of spatial integration. Unlike conventional sources, LEDs exhibit highly non-uniform spatial radiation patterns, making point measurements insufficient for determining total output. An integrating sphere, a hollow spherical cavity with a highly reflective and diffuse inner coating, serves as an ideal apparatus for this purpose. Incident light from the source under test undergoes multiple diffuse reflections, resulting in a uniform radiance distribution across the inner sphere surface.
A spectrometer, coupled to the sphere via a fiber optic cable and a cosine-corrected input optic, samples this uniform illumination. The fundamental equation governing the sphere’s operation for total flux measurement is derived from the principle of conservation of energy. The measured illuminance, E, at the detector port is proportional to the total luminous flux, Φ, of the source:
Φ = (E A) / ρ*
Where A is the internal surface area of the sphere and ρ is the average reflectance of the coating. In practice, this relationship is calibrated using a standard lamp of known luminous flux, traceable to a national metrology institute. The spectroradiometer then decomposes this integrated light into its constituent wavelengths, enabling the calculation of chromaticity coordinates (CIE x, y; u’, v’), correlated color temperature (CCT), color rendering index (CRI), and spectral power distribution (SPD). For pulsed or dimmable LEDs, the system must be synchronized with the source’s drive electronics to capture transient phenomena and dimming performance accurately.
Architectural Overview of the LISUN LPCE-3 Integrated Testing System
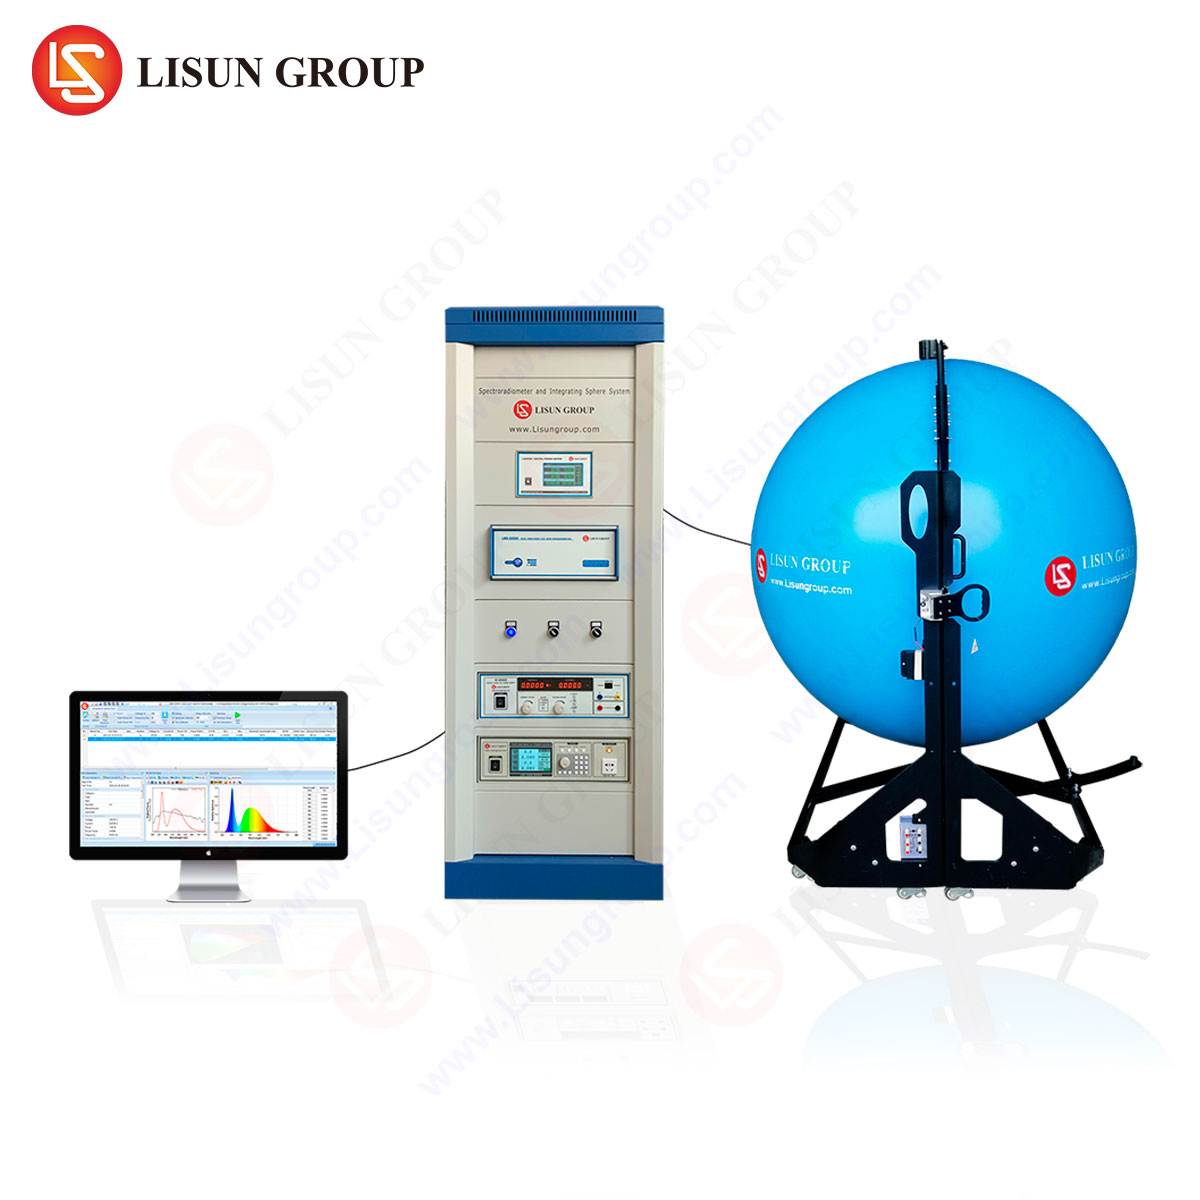
The LISUN LPCE-3 Integrated Testing System exemplifies a modern solution engineered to address the multifaceted demands of LED metrology. This system comprises a high-reflectance integrating sphere, a high-precision CCD array spectroradiometer, and specialized software for data acquisition, analysis, and reporting. The system is designed to conform to the requirements of CIE, IEC, and other international standards, including IES LM-79-19 and ENERGY STAR® for solid-state lighting.
The core specifications of the LPCE-3 system include a spectroradiometer with a wavelength range of typically 380nm to 780nm, covering the entire visible spectrum with a high optical resolution. The integrating sphere is available in various diameters (e.g., 0.5m, 1m, 1.5m, 2m) to accommodate sources of different sizes and total flux outputs, minimizing self-absorption errors. The sphere’s interior is coated with a stable, spectrally neutral diffuse material, such as Spectraflect® or BaSO₄, to ensure high reflectance (>95%) and minimal spectral distortion. The system’s software automates the calibration process, corrects for thermal drift, and calculates a comprehensive suite of photometric, colorimetric, and electrical parameters.
Key Measurable Parameters:
- Photometric: Luminous Flux (lm), Luminous Efficacy (lm/W), Luminous Intensity (cd)
- Colorimetric: Chromaticity Coordinates, CCT (K), CRI (Ra), Peak Wavelength, Dominant Wavelength, Color Purity
- Electrical: Voltage (V), Current (A), Power (W), Power Factor
- Spectral: Spectral Power Distribution (SPD)
Application-Specific Protocols Across Industrial Sectors
The versatility of advanced LED measurement systems is demonstrated by their critical role in disparate industrial domains, each with unique performance criteria and regulatory frameworks.
Automotive Lighting Testing: In this sector, stringent safety standards (e.g., ECE, SAE, FMVSS) govern the photometric performance of headlamps, signal lights, and interior lighting. The LPCE-3 system is employed to validate the luminous intensity distribution, color coordinates of signal lights (e.g., ensuring red light falls within the legally defined chromaticity bounds), and the stability of adaptive driving beam systems. The system’s ability to measure flicker percentage is crucial for mitigating temporal light artifacts that can cause driver distraction.
Aerospace and Aviation Lighting: Navigation lights, cockpit displays, and cabin mood lighting require extreme reliability and precise color specification. Testing must account for wide operational temperature ranges and vibration. The integrating sphere system provides the baseline spectral and flux data for qualification testing, ensuring that lighting maintains its specified performance under harsh environmental conditions as per standards like DO-160.
Display Equipment Testing: For LED backlight units (BLUs) in LCDs and micro-LED displays, color uniformity and gamut are paramount. The LPCE-3 can be used to characterize the SPD of the BLU, which directly influences the display’s color gamut coverage (e.g., DCI-P3, Rec. 2020). Consistency in CCT and color point across the panel is critical for high-end monitors and televisions.
Photovoltaic Industry: While not a lighting application, the precise spectral measurement of solar simulators is vital for testing photovoltaic cells. The LPCE-3 system can verify that a solar simulator’s output conforms to defined air mass spectra (e.g., AM1.5G) as per IEC 60904-9, ensuring the accuracy of cell efficiency ratings.
Medical Lighting Equipment: Surgical and diagnostic lighting demands exceptional color rendering and minimal shadowing, often quantified by metrics beyond CRI, such as the TM-30 (IES Rf, Rg) framework. Furthermore, the assessment of photobiological safety per IEC 62471 is mandatory, requiring accurate spectral irradiance data to classify risk groups for blue light, retinal thermal, and UV hazards.
Addressing Measurement Uncertainties and System Calibration
The metrological integrity of any testing regimen is defined by its measurement uncertainty. In integrating sphere spectroradiometry, key uncertainty components include:
- Spatial Non-uniformity: Deviations from perfect Lambertian distribution within the sphere.
- Spectral Accuracy: Calibration traceability and wavelength precision of the spectroradiometer.
- Stray Light: Unwanted light reaching the detector from external sources or internal reflections.
- Temperature Dependence: LED output is highly sensitive to junction temperature, requiring thermal stabilization during testing.
- Self-Absorption: The presence of the test source and its holder inside the sphere alters the sphere’s multiplier, an effect corrected for by using an auxiliary lamp.
The LPCE-3 system mitigates these uncertainties through design and protocol. The use of baffles within the sphere prevents first-reflection light from reaching the detector, improving spatial response. Regular calibration against NIST-traceable standard lamps and wavelength sources ensures long-term accuracy. The software incorporates algorithms for stray-light correction and allows for temperature monitoring and control during the test sequence.
Comparative Analysis of System Configurations for Varied Applications
The selection of an appropriate integrating sphere size is a critical consideration that balances measurement accuracy with practicality. The table below outlines the trade-offs for different sphere diameters in the context of the LPCE-3 system.
| Sphere Diameter | Typical Application Scope | Advantages | Limitations |
|---|---|---|---|
| 0.5 Meter | Single LED packages, low-power modules, R&D on chip-level devices. | Compact footprint, rapid measurement cycle, lower cost. | Higher self-absorption error for larger sources, limited dynamic range for very high flux sources. |
| 1.0 Meter | General-purpose LED lamps, bulbs, and light engines; most common in manufacturing QC. | Optimal balance of accuracy and size, suitable for a wide range of commercial products. | Requires more lab space than smaller spheres. |
| 1.5 – 2.0 Meter | High-bay luminaires, street lights, automotive headlamps, and other large, high-flux systems. | Minimized self-absorption error, accurate measurement of spatially complex sources. | Significant laboratory space requirement, higher cost, longer stabilization times. |
Software-Driven Data Management and Compliance Reporting
The value of a measurement system is fully realized through its data processing and reporting capabilities. Advanced software, such as that accompanying the LPCE-3, transforms raw spectral data into actionable intelligence. It automates the testing workflow, from instrument initialization and calibration to data acquisition and analysis. The software generates comprehensive test reports that can be customized to include specific parameters, pass/fail limits, and graphical data like SPD and CIE 1931 chromaticity diagrams. This functionality is indispensable for quality assurance departments that must demonstrate compliance with industry standards and maintain auditable production records. The capacity for batch testing and statistical process control (SPC) analysis further enhances its utility in high-volume manufacturing environments.
Frequently Asked Questions
Q1: Why is an integrating sphere necessary for measuring LED luminous flux when a goniophotometer can also be used?
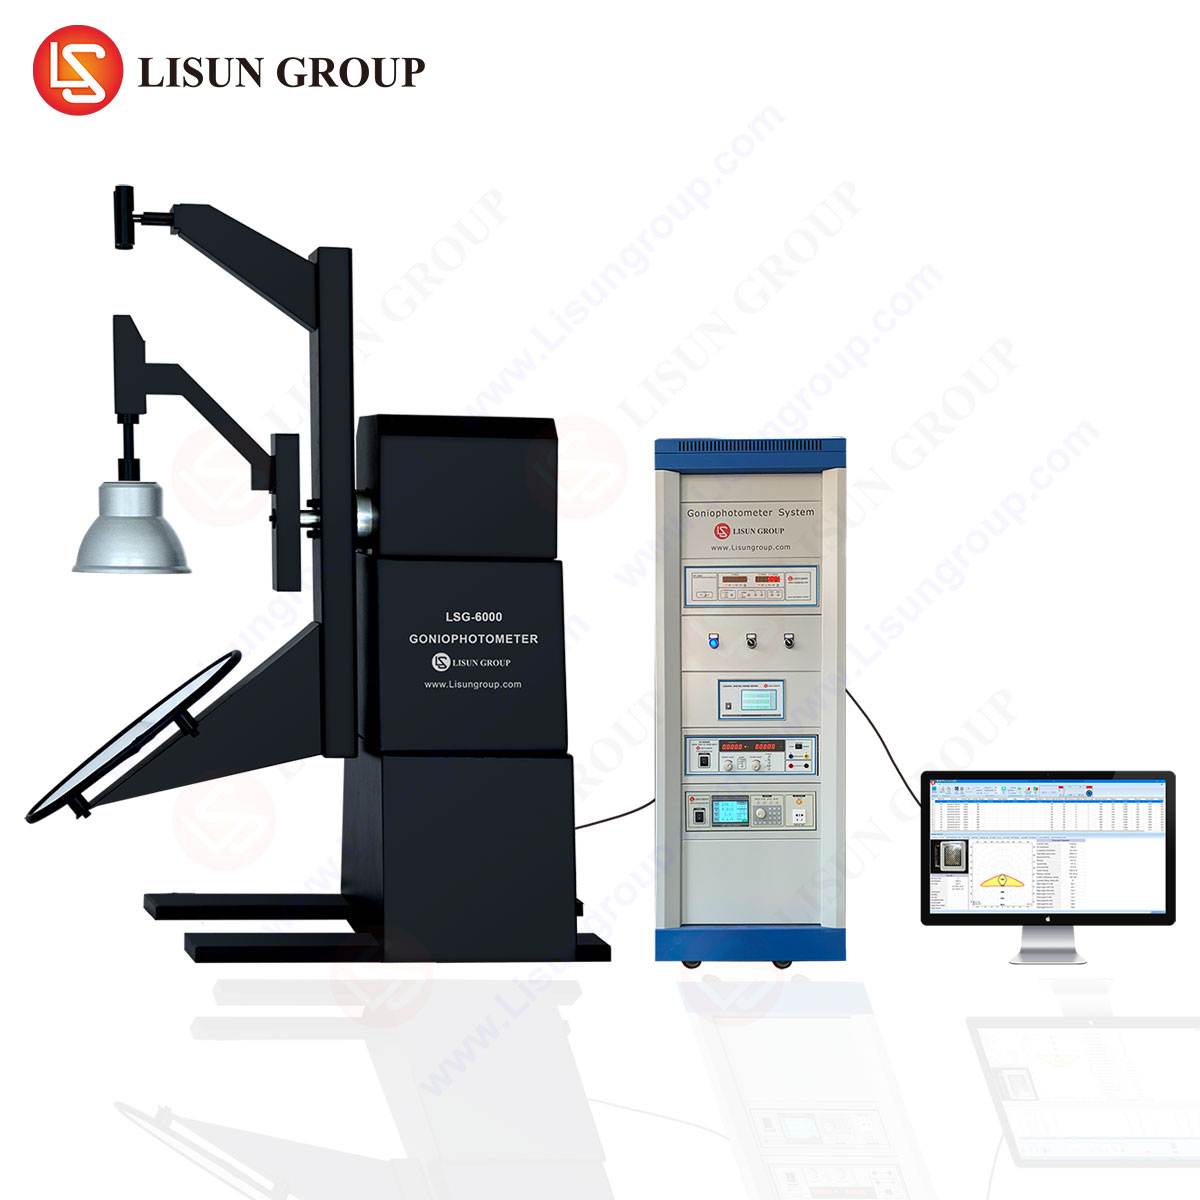
While a goniophotometer is the reference method for determining the complete spatial distribution of luminous intensity, it is a time-consuming process. An integrating sphere provides a rapid, accurate measurement of total luminous flux by spatially integrating the light output in a single measurement. For many quality control and R&D applications where the complete intensity distribution is not required, the sphere offers a significant efficiency advantage.
Q2: How does the LPCE-3 system account for the junction temperature dependency of LED parameters?
LED characteristics are strongly influenced by their junction temperature. The LPCE-3 system addresses this by incorporating a temperature-controlled mounting base or an integrating sphere with a thermal management port. The standard protocol requires operating the LED until it reaches thermal equilibrium at a specified ambient temperature (e.g., 25°C ± 1°C) before commencing photometric and colorimetric measurements, as stipulated in standards like IES LM-79-19.
Q3: Can the system measure the flicker of LED lighting products?
Yes, modern spectroradiometer systems like the LPCE-3, when equipped with high-speed acquisition capabilities and synchronized with the source’s power supply, can capture temporal light output. The software can then calculate flicker metrics such as percent flicker and flicker index, which are critical for assessing visual comfort and potential biological impacts.
Q4: What is the significance of measuring Color Rendering Index (CRI) and the newer IES TM-30 metrics?
CRI (Ra) is a long-standing metric that quantifies a light source’s ability to reveal the colors of various objects faithfully compared to a reference source. However, it has known limitations, particularly with saturated colors and for LED sources. The IES TM-30-20 method provides two complementary measures, Rf (Fidelity Index) and Rg (Gamut Index), which offer a more comprehensive and reliable evaluation of color rendition. Advanced systems are capable of reporting both CRI and TM-30 metrics.
Q5: How often should the integrating sphere system be calibrated to maintain accuracy?
The calibration interval depends on the usage frequency, environmental conditions, and the required level of measurement certainty. For most industrial quality control labs, an annual calibration is recommended. For research and standards laboratories, a semi-annual or even quarterly calibration may be necessary. Calibration should always be performed using standards traceable to a national metrology institute.


